
Voltage drop and conductors
Why conductor temperature changes resistance and voltage drop
A cable’s resistance is not fixed at every temperature. Load and installation conditions influence the value used in voltage-drop and loss estimates.
Try the temperature-adjusted resistivity mode →Published 26 September 2026
Resistance is temperature-dependent
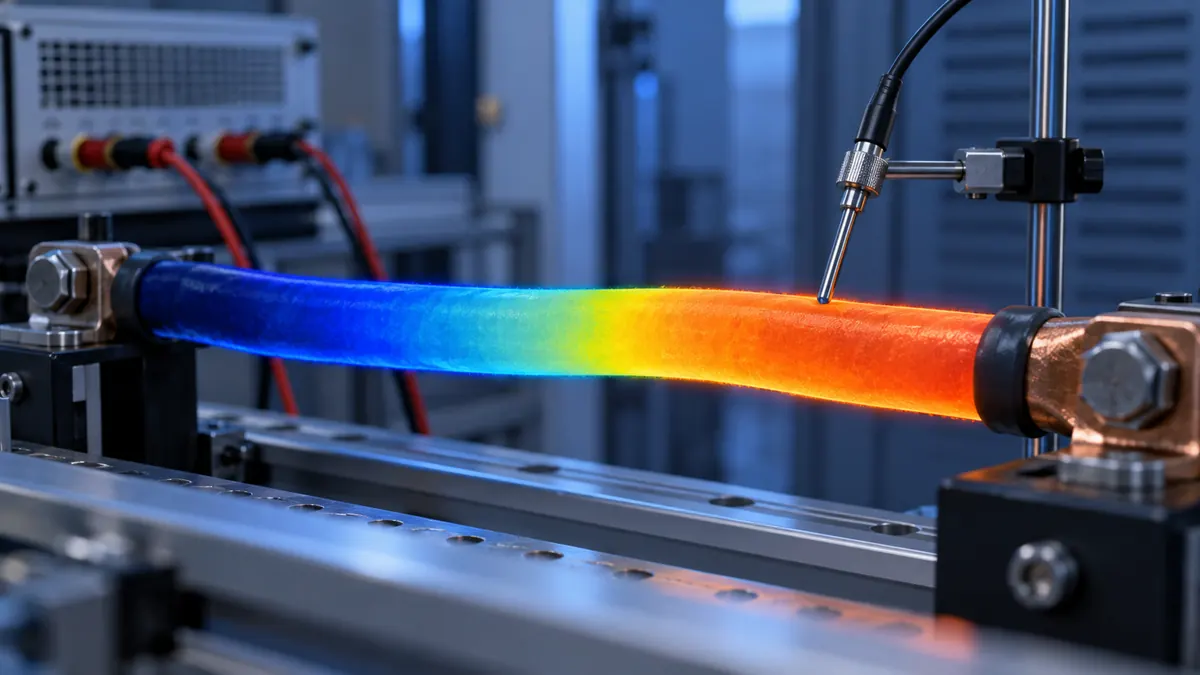
Metal conductor resistance generally rises as temperature rises. More resistance produces more voltage drop for the same current and route, and it increases resistive loss.
A simplified linear adjustment is:
RT = R20 × [1 + α(T − 20)]
where R20 is resistance at 20°C, T is conductor temperature and α is a material temperature coefficient.
A copper example
Using the calculator’s simplified copper coefficient of 0.00393 per °C, a conductor at 80°C has a resistance multiplier of:
1 + 0.00393 × (80 − 20) = 1.2358
The estimated resistance is about 23.6% higher than at 20°C. A voltage-drop calculation based only on the cold value would therefore understate the resistive contribution under that assumed hot condition.
Conductor temperature is not ambient temperature
Ambient air may be 40°C while a loaded conductor operates hotter. The conductor temperature depends on current, installation method, grouping, thermal surroundings and heat dissipation. Do not enter ambient temperature as conductor temperature without a basis.
Likewise, a maximum insulation temperature is not automatically the normal operating temperature to use for every voltage-drop study.
A feedback effect
Higher current produces more I²R heating. Heating raises resistance, which increases loss further until a thermal balance is reached. Full cable-rating methods account for heat transfer and installation conditions; the simple voltage-drop adjustment does not solve that thermal system.
Copper and aluminium differ
The two materials have different reference resistivities and temperature coefficients. For equal cross-sectional area and route length, aluminium has higher resistance in the simplified model. Practical cable comparison also involves size, mass, joints, terminations and manufacturer construction.
Use the right source value
Manufacturer or reviewed cable data may already state resistance at an operating temperature. Do not adjust it again without checking the basis. Record the original temperature, adjusted temperature, material and formula.
ElectricalDyev’s resistivity mode is intentionally labelled simplified. It helps show why temperature matters and supports early comparisons. Replace it with traceable cable-specific data when the result will influence design, procurement or construction.
The linear temperature model
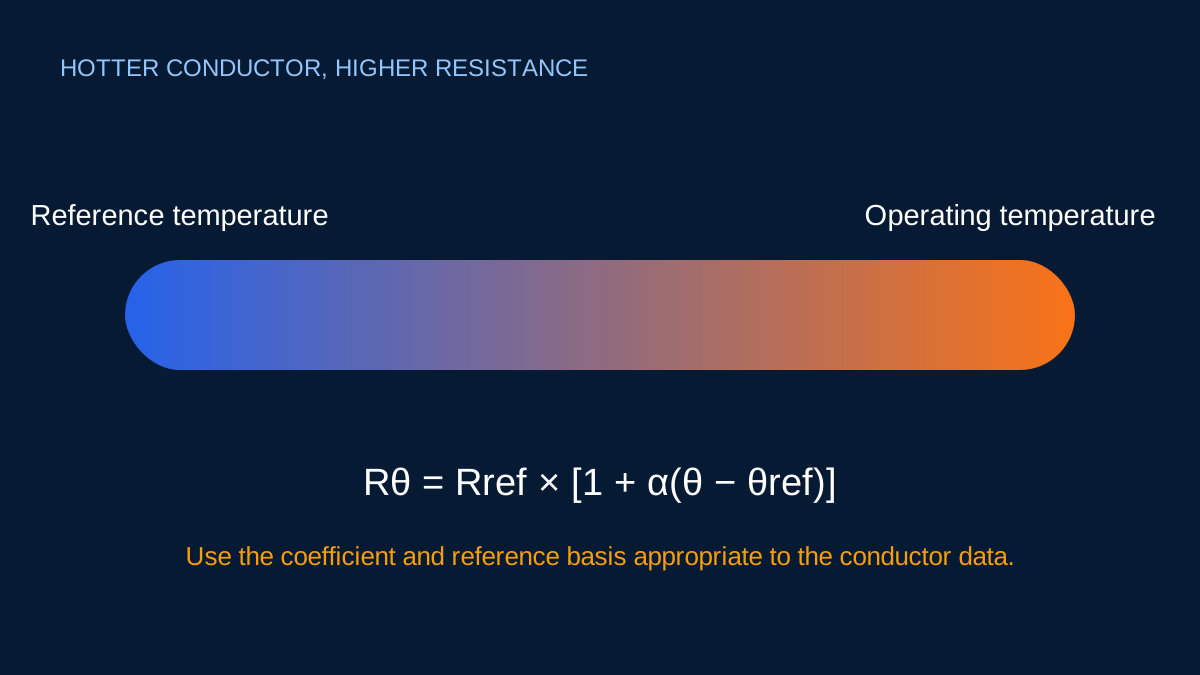
Over an ordinary engineering range, resistance is often approximated from a reference value:
Rθ = Rref × [1 + α(θ − θref)]
For copper with a representative coefficient around 0.00393 per °C, a conductor that is 1.00 Ω at 20°C would be approximately:
R80 = 1.00 × [1 + 0.00393 × (80 − 20)] = 1.236 Ω
That is about a 23.6% increase. If current and geometry stay the same, the resistive component of voltage drop and I²R loss rise accordingly. The example explains direction and scale; use the coefficient and reference basis supplied with the actual engineering data.
Conductor temperature is not ambient temperature
Ambient air or soil temperature is one input to conductor heating, not necessarily the conductor temperature itself. Load current, installation method, grouping, thermal insulation, ventilation and heat from neighbouring circuits influence the operating value.
Entering 40°C because the room is 40°C may understate conductor resistance when a loaded cable runs hotter. Conversely, assuming the maximum insulation rating as the normal operating temperature can overstate routine drop. Document whether temperature is measured, calculated, table-based or a conservative assumption.
AC resistance is more than DC resistivity
The simple ρL/A relationship estimates DC resistance from material resistivity and area. Real AC cable resistance can also reflect strand construction, skin effect, proximity effect and metallic components. Manufacturer R/X data is therefore preferable when a cable-specific AC result matters.
Contact and termination resistance are separate from the uniform conductor estimate. A poor joint can create local heating and voltage drop that the route calculation does not predict.
Use consistent reference data
Check whether resistance is stated per conductor, per kilometre, at 20°C, at a maximum operating temperature, or as a maximum test value. If a source already supplies resistance at 90°C, applying a second temperature correction from 20°C would over-adjust it.
Store the original value, reference temperature, adjusted value and coefficient in the calculation record. That trace lets a reviewer update the result when a better operating-temperature estimate becomes available.
Sources and limits
Preliminary engineering aid only. The linear resistivity model is educational; use manufacturer cable data and the relevant operating condition for design.
Verify applicable laws, standards, manufacturer data and project conditions with a qualified electrical professional before construction, procurement or regulatory submission.
CONTINUE READING
Related articles
Voltage drop and conductors
Resistance, reactance and power factor in AC voltage drop
R and X do not contribute identically to the in-phase voltage change. Power factor sets the weighting in the common approximation.
Voltage drop and conductors
Copper and aluminium in preliminary conductor calculations
Material changes resistance, but a practical cable choice also involves size, joints, installation, thermal behavior and product data.
Protection and project workflow
How cable correction factors combine
Correction factors multiply. Their source conditions and applicability matter as much as the arithmetic.